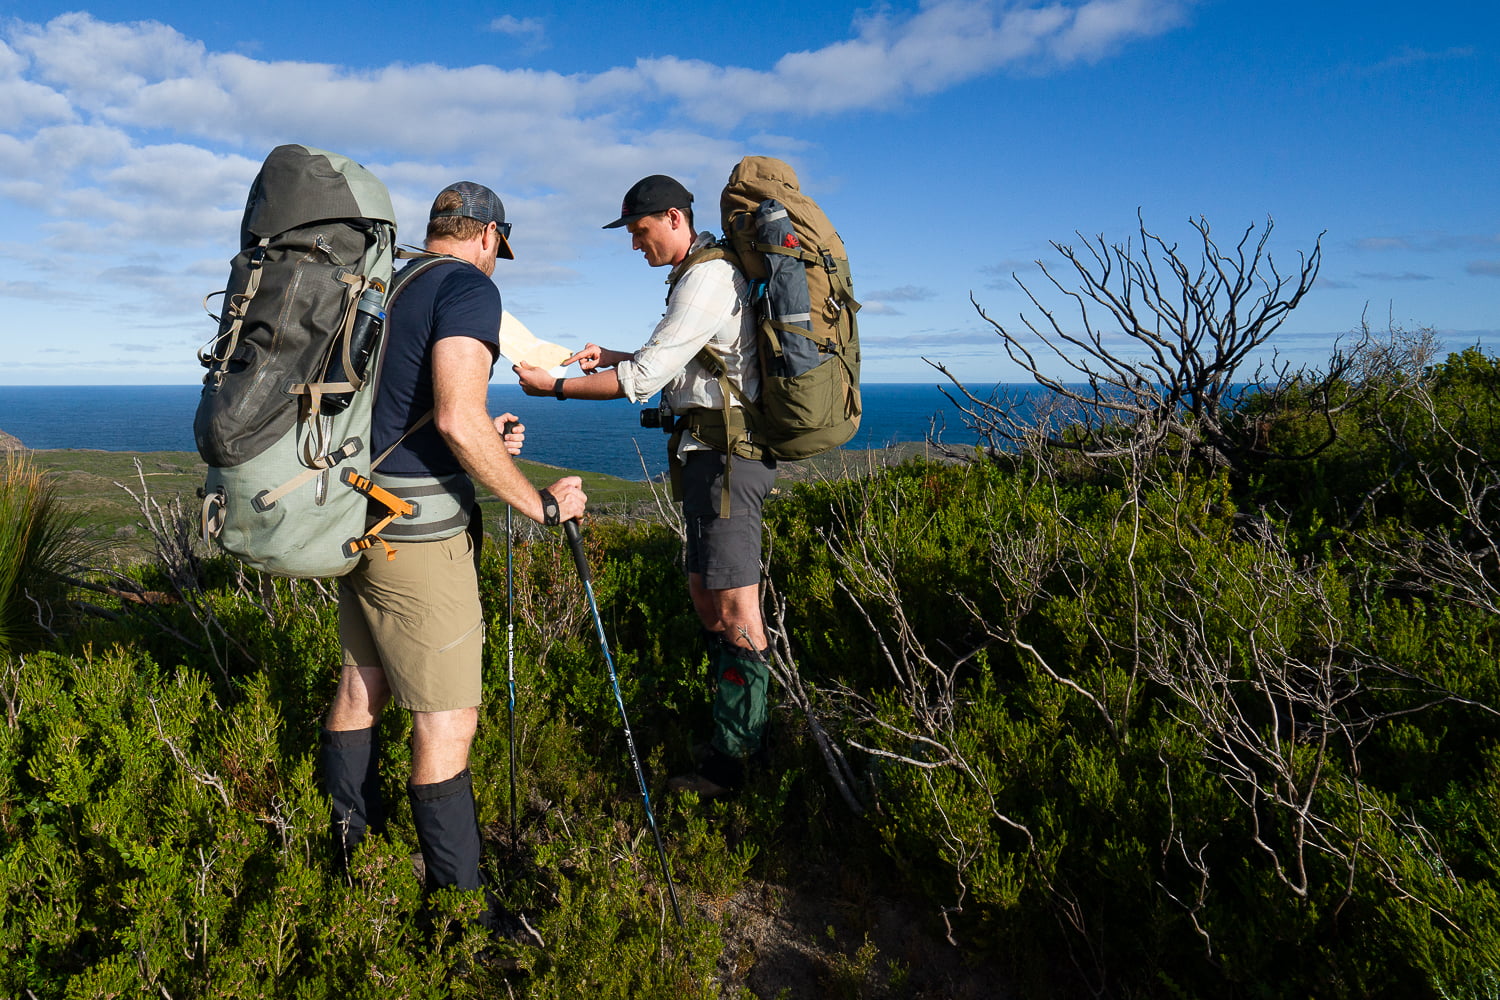
I’ve never met a person who doesn’t love looking at a map. Whether it’s a map of your local park, topographic map or a world globe, they give us opportunities to dream, imagine and plan our future adventures.

There was a time, not so long ago, when a physical map and a compass was the only way in which we could find ourselves in wild places. Now, even in the age of internet connections and GPS tracking the humble map remains relevant not only to romantics like myself but also as a vital redundancy should the batteries run out (gasp!).
For maps to be useful, we need to understand them. It’s important to know what we are looking for so we can choose an appropriate one for the adventure we are going on. For example, if we were to accidentally buy a marine chart for a land adventure, while it may cover the area, it provides no information about the features of landmasses.
In this article, we are going to look at topographic maps, which are the maps with the features most relevant to self-powered, land-centric adventures like hiking and bikepacking. Topo maps detail all the natural and human-made features in a defined area, such as trails, roads, peaks and rivers. They also use contour lines to give us an indication of the steepness of the terrain. Topo maps come in several scales, but the detail most relevant to hiking is 1:25,000 and 1:50,000 which we’ll explain in a bit more detail.

What’s the Difference Between 1:25,000 and 1:50,000 Scale Topographic Maps?
On a 1:50,000 scale topographic map, 1mm on the map represents 50,000mm (50 metres) on the ground, and each square is 20mm x 20mm, which represent 1km x 1km.
A 1:25,000 topographic map is equivalent to zooming into double the size of 1:50,000. 1mm on the map now represents 25m on the ground. The beautiful thing here is that the scaling is maintained. So while the squares on a 1:25,000 are now 40mmx40mm, they still represent 1km x 1km on the ground. This feature allows us to see how much extra detail a 1:25,000 map represents compared to 1:50,000.

1:50,000 Scale Maps Explained
For example, in this article, we have two representations of the same 3km x 2km area of coastline (in Western Australia, near Walpole). The first representation we will discuss is the 1:50,000 scale. You can see squiggly orange lines covering the area; if you’re new to maps, these are called contour lines and show us the steepness of the terrain.

If you walked the path of one of these lines, following it accurately, you would find yourself neither going up nor downhill, as the path of each line maintains a particular elevation. The lines are 20m apart vertically, so if you walked the most direct route between two contours on the ground, you would be walking up or down the steepest possible slope.
Where contour lines are closer together the land is steeper; more elevation is being gained or lost over a smaller distance. Where they are further apart, the earth is flatter. Contour lines allow us to transpose a three-dimensional world onto a two-dimensional map. We know whether the land is rising or falling because some contour lines have their elevation written on them, and local high points also have their heights marked. Using this information, we can see whether we would be walking up or downhill if we took off in any direction.
Beyond contour lines we can also see thicker orange lines with short dash marks coming off, these are cliffs. Creeks are blue lines, in the map above we can see two coming up from Thompson cove, in a “Y” shape. Tracks are the purple lines.
Mount Hopkins, a local high point of note, is important enough to be marked by name. Its height is 204 metres above sea level. We can imagine Mount Hopkins as being a gentle hillock, as the contour lines approaching the summit aren’t tight together. We know that the top of the hill features’ numerous rocky outcrops’ rising out of the heath, which is sand coloured.
This 1:50,000 topographic map scale gives us enough information to navigate in this type of terrain, while also helping us to picture what it’s going to look like without having visited the area. In more mountainous, confusing terrain the extra detail garnered from a 1:25,000 scale map might be required.
1:25,000 Scale Maps Explained
As with the 1:50,000 scale topographic map, this map features contour lines. The key difference here is that there are many more of them! On 1:25,000 scale maps the contour lines are 5 metres apart vertically, giving much more detail to the steepness of the terrain.

We can see, with this extra detail, that some of the areas that the 1:50,000 scale map represents as cliff are very steep slopes. They are still impassable on foot, but not the sheer drops the 1:50,000 scale map would lead you to believe they are. We can also see that with this extra contour information, many other navigational features like tracks have been removed or lightened to give clarity to the contour lines. For this reason, a 1:25,000 map is only the best choice in an area where steepness and difficult terrain necessitates that contour lines are the most important navigational aid.
Which Scale Map Should I choose?
Whether you need a 1:25,000 or 1:50,000 scale map depends on where you are going, and the level of navigational experience you have. 1:50,000 scale maps are the most commonly available maps for bushwalking in Australia. For the most part, they provide more than enough information to comfortably and safely make your way through the wilderness. 1:25,000 scale topographical maps are useful for particularly tricky navigation, such as in the Stirling Ranges of Western Australia. Here the 20-metre contour spacing given by 1:50,000 scale maps does not provide enough information to represent the terrain adequately.

Where to Find Topographic Maps
Geoscience Australia has several 1:50,000 scale topographical maps available for free download through their website. State Governments hold more extensive mapping, including 1:25,000 scale maps, in their databases which are available as high-quality PDFs at a cost. The Geoscience website also includes information on how to access State Government mapping.
As you’ll need to print maps obtained digitally, often it’s best to visit your local map shop, who will be able to print the map you need.
The 1:50,000 scale map I used for this article I found through Geoscience Australia by searching “Deep River 1:50,000” and then clicking “Download the map (.tif)”. The 1:25,000 scale map I used is the Saddle Island-NE map, which I purchased through Landgate, the Western Australian Government agency responsible for mapping. Each topographical map from Landgate costs $13, and they email it to you as a high-quality PDF.

